This guide is for SREs and platform engineers. It walks through deploying HAMi AI Platform to a Kubernetes cluster and integrating with HAMi, Prometheus, NVIDIA GPU Operator, Gateway API, and other foundational components.
⚠️ Installation ≠ Activation
After completing the Helm installation in this section, HAMi AI Platform components will be running. However, HAMi Enterprise's underlying GPU virtualization and scheduling features require a license activation to work properly.
The installation itself does not depend on a license, so you can complete the deployment first, then apply for and import the license in the subsequent steps.In short: Install the software first, then obtain the license; vGPU partitioning and scheduling will not work without activation, and verification will fail.
Architecture & Positioning
HAMi AI Platform (Dynamia Intelligent Heterogeneous Compute Scheduling and Virtualization System) is an application platform deployed on top of Kubernetes clusters, providing unified scheduling, tenant quota, monitoring visualization, and developer workspaces for heterogeneous compute. Key characteristics:
- Federated control plane: connects to the Dynamia cloud HAMi enterprise platform control plane; one tenant manages multiple clusters
- Unified management interface: built-in admin, monitoring, and user consoles
- Open & composable: relies on standard K8s ecosystem (Prometheus, Helm, Gateway API, HAMi device plugin)
Best fit for: multi-tenant GPU sharing, memory oversubscription, heterogeneous accelerator (NVIDIA / Ascend / Hygon DCU / etc.) unified scheduling, plus developer workspaces and federated cluster management.
Prerequisites
Run the checks below on each Kubernetes cluster you plan to onboard:
| Type | Requirement | Verify |
|---|---|---|
| Kubernetes | ≥ 1.24 | kubectl version --short |
| Container Runtime | containerd or Docker | kubectl get nodes -o wide |
| Helm | ≥ 3.14 | helm version --short |
| GPU Driver | NVIDIA driver ≥ 470 (≥ 550 recommended) | nvidia-smi |
| Prometheus | ≥ 2.37 (if integrating monitoring) | kubectl get pods -A | grep prom |
| GPU Operator | Installed AND devicePlugin.enabled = false (recommended version: v25.3.2) | helm list -A | grep gpu-operator |
| Cluster Storage | default StorageClass configured or self-managed PVC | kubectl get sc |
Critical constraint: HAMi ships its own device-plugin and conflicts with the NVIDIA GPU Operator's built-in device-plugin. If GPU Operator is installed, you must disable its device-plugin via
--set devicePlugin.enabled=false.
Install HAMi Enterprise
HAMi AI Platform depends on HAMi Enterprise as the underlying GPU virtualization and scheduling layer. Complete HAMi Enterprise deployment and activation first.
Two installation paths — choose based on your scenario:
- Online OCI install (evaluation, PoC, clusters with external network access)
- All-in-One Air-gap Bundle (finance / government / telecom isolated networks)
Regardless of path, you must apply for and activate a license at the end.
Path A: Online OCI Chart Install
If you wish to use a Chinese domestic mirror registry, please contact Dynamia.ai sales/support for details.
We recommend using a version tracking system to maintain values files for all Helm releases in the cluster. Use -f example-values.yaml to override corresponding keys in the chart's default values.
After selecting the correct kubeconfig context, proceed:
If you haven't installed nvidia/gpu-operator yet, install it first.
helm repo add nvidia https://helm.ngc.nvidia.com/nvidia && helm repo update

helm install --wait --generate-name \
  -n gpu-operator --create-namespace \
  nvidia/gpu-operator \
  --set devicePlugin.enabled=false \
  --set dcgmExporter.serviceMonitor.enabled=true \
  --version=v25.3.2
If the cluster doesn't have a Prometheus monitoring stack, you'll also need to install one. Here's how to install prometheus-community/kube-prometheus-stack:
helm install prometheus \
  oci://ghcr.io/prometheus-community/charts/kube-prometheus-stack \
  --version 72.3.0 \
  --namespace monitoring \
  --create-namespace \
  --set alertmanager.enabled=false \
  --set grafana.enabled=false
Install dynamia-ai/hami-enterprise(hami-commercial):
helm install hami \
  oci://ghcr.io/dynamia-ai/hami-commercial/hami \
  --version 2.9.0-rc1 \
  --namespace hami-system \
  --create-namespace
hami-enterprise(hami-commercial) common chart customization options are listed below. For the complete values reference, see: HAMi Helm Values Reference.
| Parameter | Description | Default |
|---|---|---|
dra.enabled | Enable DRA | false |
scheduler.leaderElect | Enable leader election for hami-scheduler | true |
scheduler.replicas | Number of hami-scheduler replicas | 1 |
scheduler.kubeScheduler.image.registry | Registry for kube-scheduler image used by hami-scheduler | "registry.cn-hangzhou.aliyuncs.com" |
scheduler.kubeScheduler.image.repository | Repository for kube-scheduler image used by hami-scheduler | "google-containers/kube-scheduler" |
scheduler.kubeScheduler.image.tag | Tag for kube-scheduler image used by hami-scheduler. If empty, the chart will infer an appropriate version. | "" |
(Optional) Install envoyproxy/envoy-gateway for service exposure:
helm install eg \
  oci://docker.io/envoyproxy/gateway-helm \
  --version v1.6.2 \
  --namespace envoy-gateway-system \
  --create-namespace \
  --set global.images.envoyGateway.image=docker.io/envoyproxy/gateway:v1.6.2 \
  --set global.image.ratelimit.image=docker.io/envoyproxy/ratelimit:99d85510 \
  --set config.envoyGateway.gateway.controllerName=gateway.envoyproxy.io/gatewayclass-controller \
  --set config.envoyGateway.provider.type=Kubernetes
Install dynamia-ai/hami-ai-platform(kantaloupe):
helm install kantaloupe \
  oci://ghcr.io/dynamia-ai/kantaloupe/kantaloupe-chart \
  --version 0.15.1 \
  --namespace kantaloupe-system \
  --create-namespace \
  --set fullnameOverride=kantaloupe
hami-ai-platform(kantaloupe) requires configuration for "feature flags", "service exposure", "monitoring metrics collection", etc. It has high configuration flexibility, please configure as needed.
hami-ai-platform(kantaloupe) common chart customization options are listed below. For the complete values reference, see: HAMi AI Platform Helm Values Reference.
| Parameter | Description | Default |
|---|---|---|
gateway.enabled | Whether to create Gateway API resources and integrate with envoy-gateway | true |
gateway.service.type | Gateway Service type, one of LoadBalancer, NodePort | LoadBalancer |
gateway.service.nodePort | HTTP node port used when type is NodePort | 30080 |
gateway.tls.enabled | Whether to enable HTTPS/TLS termination | false |
gateway.tls.secretName | Secret name containing the TLS certificate | cloudflare-origin-tls |
gateway.endpoint | External gateway base URL used by the control plane (e.g. https://dashboard.example.com). When set, controller-manager uses this address directly and skips auto-discovery from Gateway status | "" |
gateway.hostnames | List of hostnames the Gateway listens on | [] |
auth.enabled | Whether to enable platform authentication (JWT login, RBAC, audit) | false |
auth.bootstrapAdminUsername | Initial platform administrator username | "" |
auth.existingAuthSecret | Name of an existing Secret containing jwt-secret and bootstrap-admin-password (recommended for production) | "" |
monitoring.enabled | Whether to create monitoring resources such as ServiceMonitor and PrometheusRule | true |
monitoring.namespace | Namespace where monitoring resources (ServiceMonitor, etc.) are created | monitoring |
hamiNamespace | Namespace where HAMi Enterprise is installed | hami-system |
controllerManager.replicaCount | controller-manager replica count | 1 |
installCRDs | Whether to create/update CRD resources during installation | true |
fullnameOverride | Override prefix for all resource names | kantaloupe |
Common configuration values examples:
- Cloud environment: use LoadBalancer to expose services
gateway:
  enabled: true
  service:
    type: LoadBalancer
  tls:
    enabled: true
    secretName: your-tls-secret
    httpRedirect: true
  hostnames:
    - your.domain
- Air-gapped environment: use envoy-gateway NodePort to expose services
gateway:
  enabled: true
  service:
    type: NodePort
    nodePort: 30080
  tls:
    enabled: false
- No additional gateway configuration
gateway:
  enabled: false
Path B: All-in-One Air-gap Bundle
Please contact Dynamia.ai sales/support to obtain the download URL.
Download hami-ai-platform-v<VERSION>-airgap-<ARCH>.tar.gz and hami-ai-platform-v<VERSION>-airgap-<ARCH>.tar.gz.sha256.
The hami-ai-platform air-gap bundle includes dynamia-ai/hami-enterprise, nvidia/gpu-operator, prometheus-community/kube-prometheus-stack, envoyproxy/envoy-gateway, and dynamia-ai/hami-ai-platform(kantaloupe). Install as needed.
# Download
curl -L -O <URL>
# Or: wget <URL>

# Extract outer tar.gz
# macOS
tar -xzf hami-ai-platform-vX.Y.Z-airgap-amd64.tar.gz
# Linux (GNU tar)
tar -xaf hami-ai-platform-vX.Y.Z-airgap-amd64.tar.gz
Verify integrity:
# Linux / macOS
shasum -a 256 -c hami-ai-platform-vX.Y.Z-airgap-amd64.tar.gz.sha256

# Or manually compare
shasum -a 256 hami-ai-platform-vX.Y.Z-airgap-amd64.tar.gz
cat hami-ai-platform-vX.Y.Z-airgap-amd64.tar.gz.sha256
For the subsequent installation steps, refer to the extracted DEPLOY.md file.
Enable GPU Nodes
The HAMi device plugin only starts on nodes labeled gpu=on:
kubectl label nodes <node-name> gpu=on
Verify:
kubectl -n hami-system get podsshould showhami-device-plugin-*andhami-scheduler-*inRunningstate.
Monitoring Integration
Ensure Prometheus can scrape HAMi and DCGM-Exporter metrics.
The ServiceMonitor resource's
metadata.labelsmust match Prometheus'sspec.serviceMonitorSelector— otherwise Prometheus won't discover these monitors.
Verify Metrics Collection
| Exporter | Query | Expected |
|---|---|---|
| dcgm-exporter | DCGM_FI_DEV_GPU_UTIL | non-empty value |
| hami-exporter | HostCoreUtilization | non-empty value |
| hami-device-plugin-exporter | GPUDeviceCoreAllocated | non-empty value |
Activation
Please complete the above installation steps and ensure all component pods are running before proceeding with activation.
Run the following script to collect license information (requires kubectl, jq):
# Online install
curl -fsSL https://dynamia.ai/scripts/collect-hami-license-info.sh | bash

# Air-gap install (bundled in the package)
bash collect-hami-license-info.sh
After execution, you will see JSON output like:
{
  "kube_system_uid": "bd8bce4f-f440-48e0-bf74-4ea2b6419c8b",
  "collection_time": "2026-05-28T03:00:39Z",
  "hami_install_location_namespace": "hami-system",
  "total_licenses": 1,
  "licenses": [
    {
      "uuid": "GPU-6762ec8e-2ce2-9ae4-df13-3e2e5cf17e53",
      "reminder": 10,
      "expire": "2026-06-21T10:04:41.468Z",
      "node_name": "172.28.135.11"
    }
  ]
}
Send this information to Dynamia.ai sales/support to obtain your license.
Post-install Verification
# 1. Pod status
kubectl -n hami-system get pods

# 2. Device Plugin GPU resources
kubectl describe node <gpu-node> | grep -A 5 'Capacity:'
# Expect: nvidia.com/gpu: <N> and nvidia.com/gpumem: <MB>

# 3. Submit a test pod to verify scheduling
cat <<EOF | kubectl apply -f -
apiVersion: v1
kind: Pod
metadata:
  name: hami-smoke
spec:
  restartPolicy: Never
  containers:
  - name: cuda
    image: nvidia/cuda:12.4.0-base-ubuntu22.04
    command: ["nvidia-smi"]
    resources:
      limits:
        nvidia.com/gpu: 1
        nvidia.com/gpumem: 2000
EOF

kubectl logs hami-smoke
Expected: nvidia-smi shows GPU information with memory capped at 2000 MiB.
HAMi AI Platform Verification
# 1. Pod status
kubectl -n kantaloupe-system get pods

# 2. Service reachability
kubectl -n kantaloupe-system get svc
After the HAMi AI Platform service is exposed, open the site and confirm that both frontend and backend are working properly.
Create a Workload
On the Workloads page in the console, create an application (e.g. gpu-burn) via the creation wizard or an Example template:
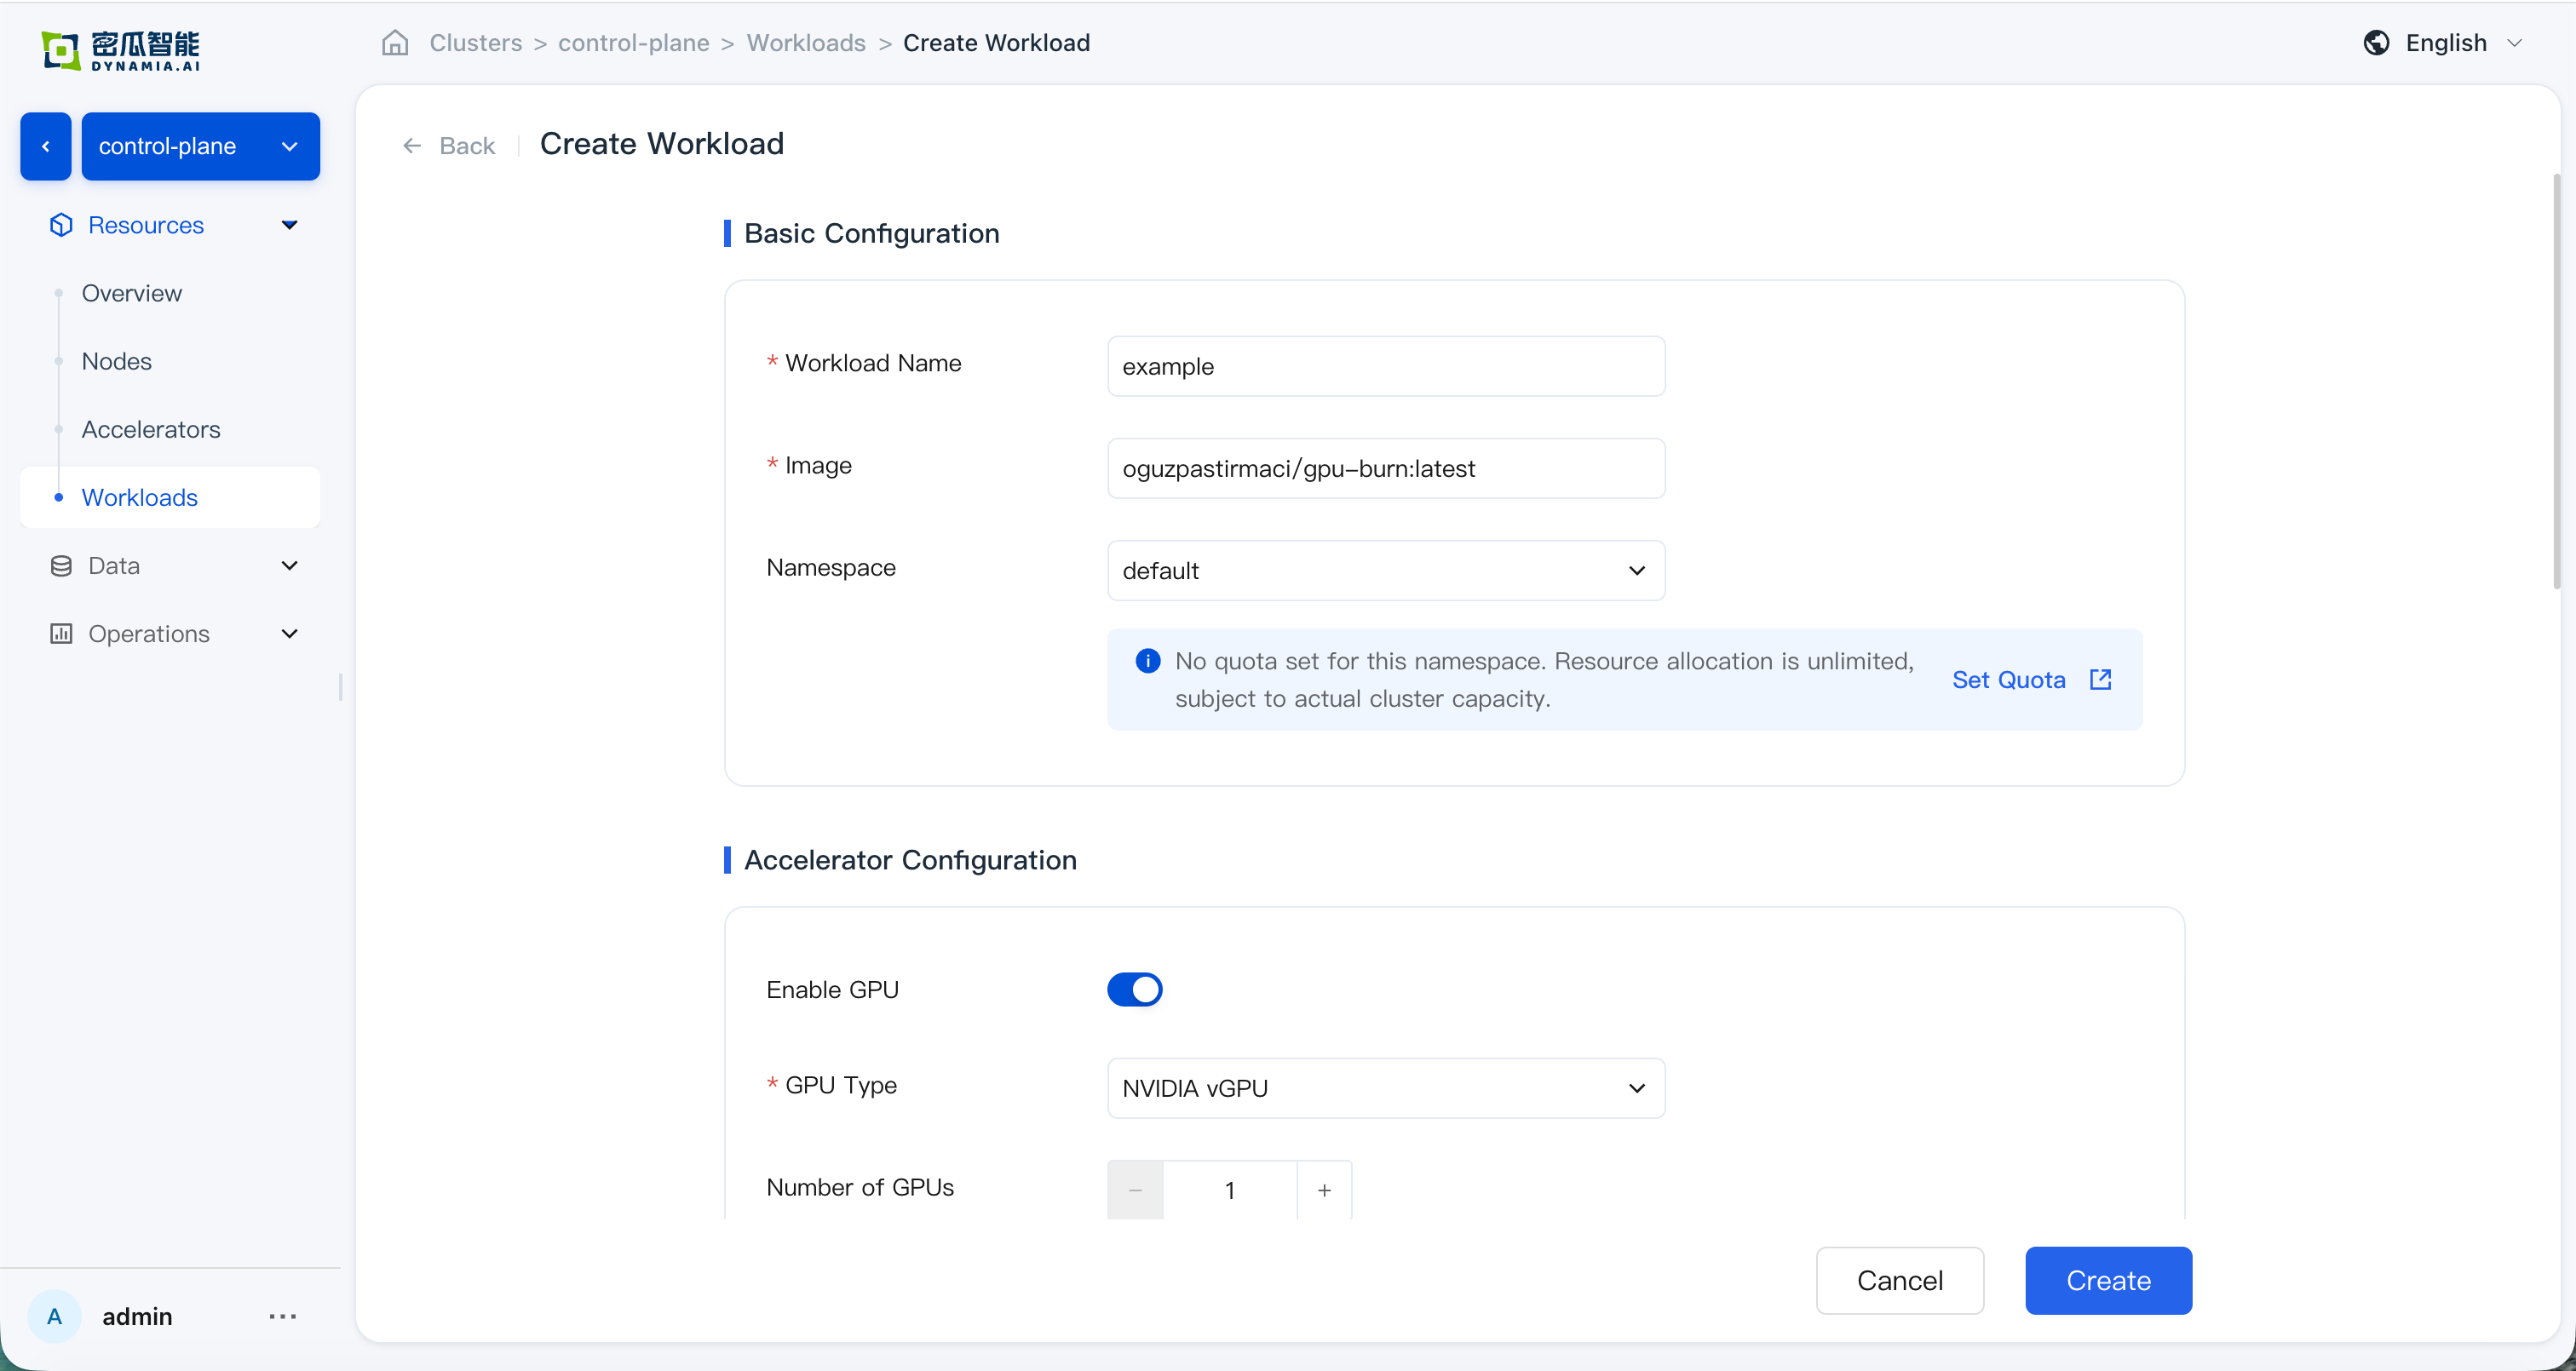
After creation, confirm that all of the following checks pass:
-
Created successfully with no console errors
-
Workload list: status, search, list metrics, and monitoring panels (GPU SM / GPU MEM / CPU / Memory) are correct; time-range switching and charts match expectations
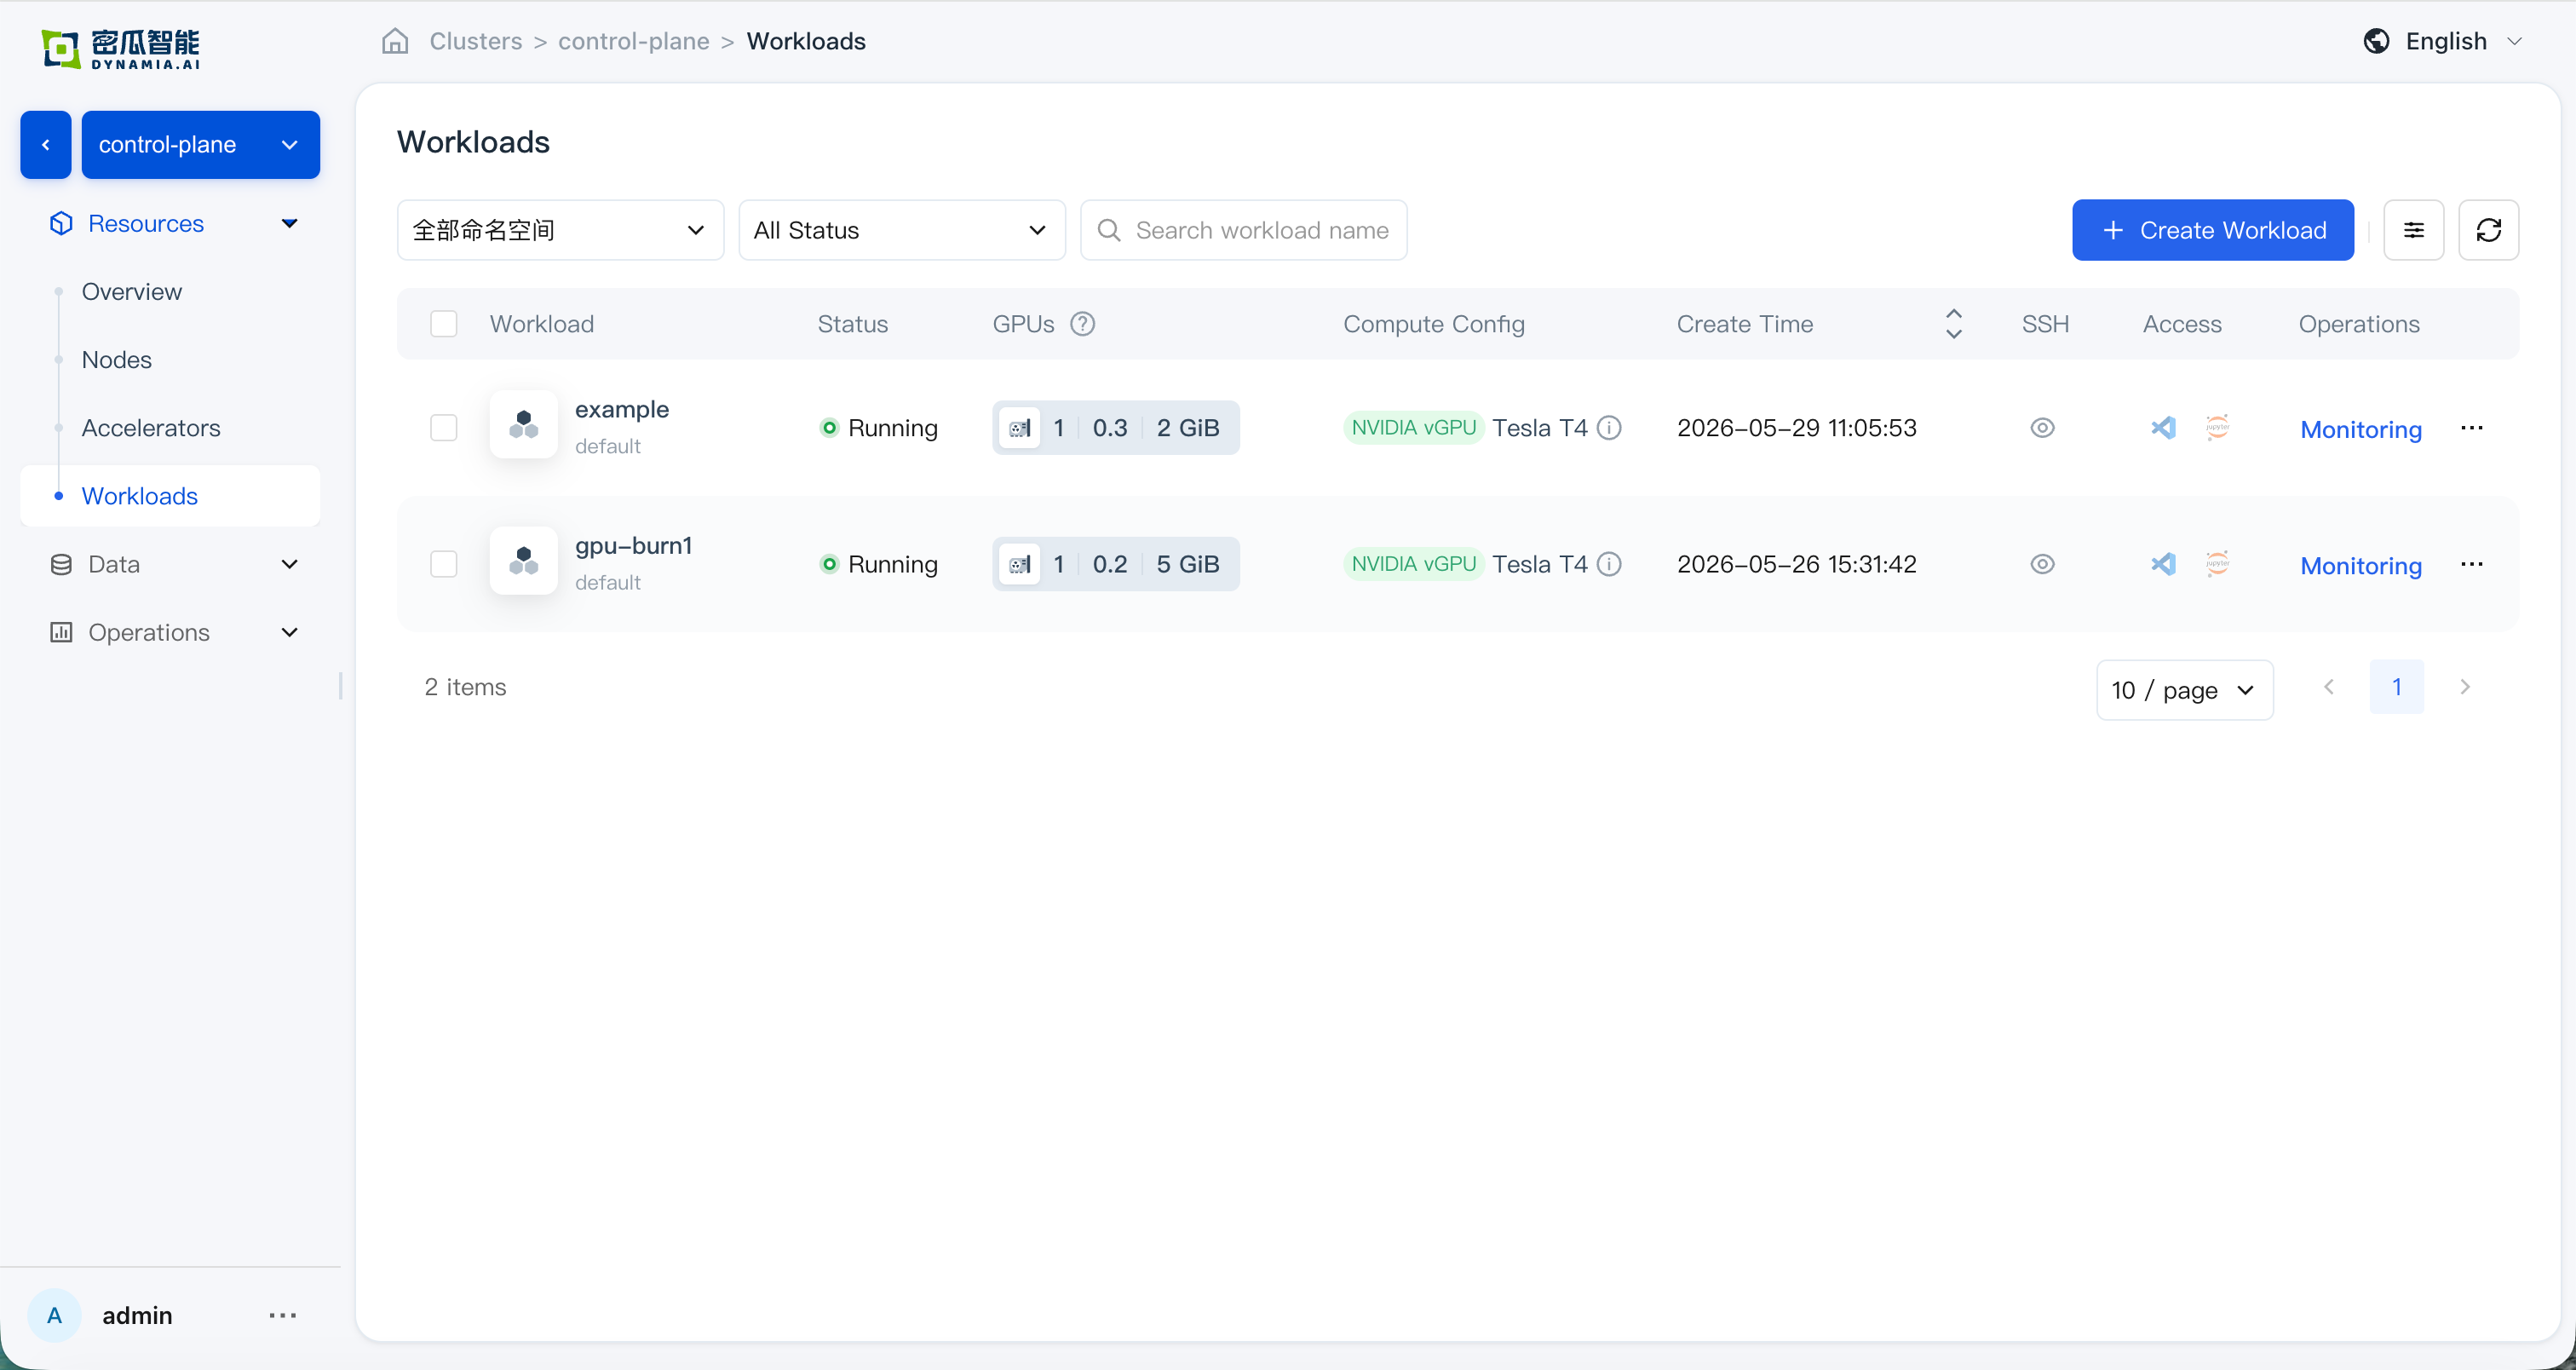
en: Workload list -
Application details: basic info, resource overview, GPU Memory Allocation (see HAMi Enterprise for verification), and monitoring data are correct; GPU and node drill-down pages show correct resource overview and monitoring data
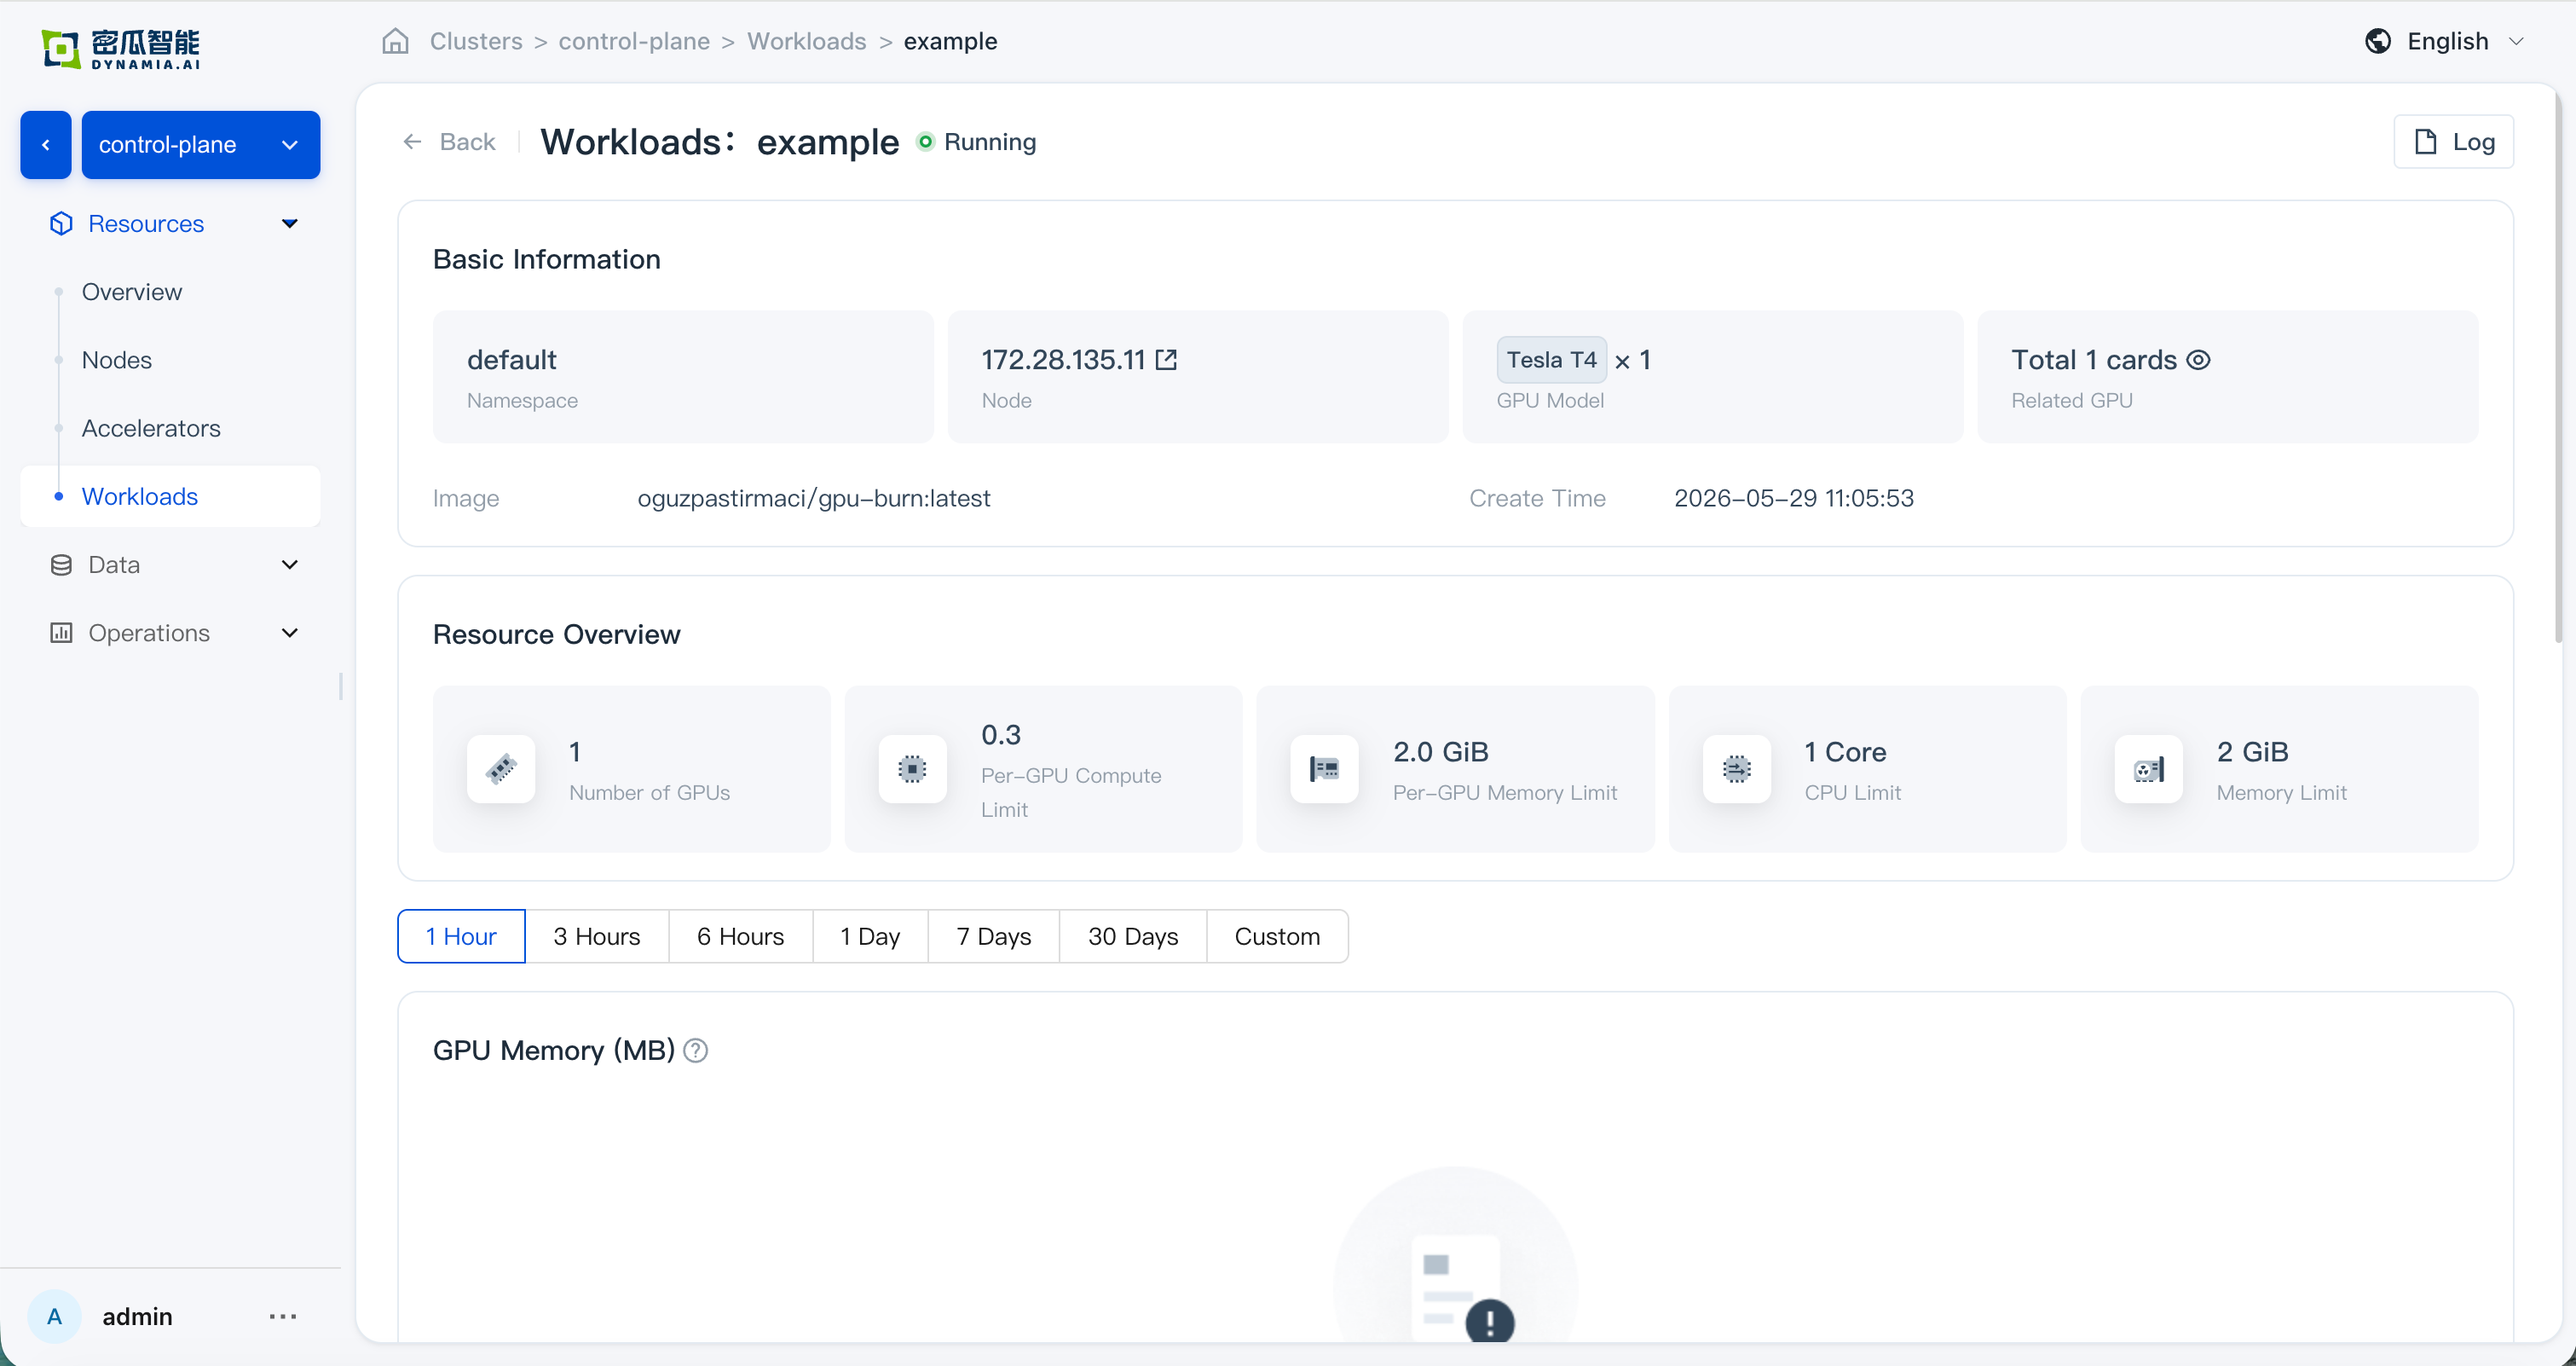
en: Application details 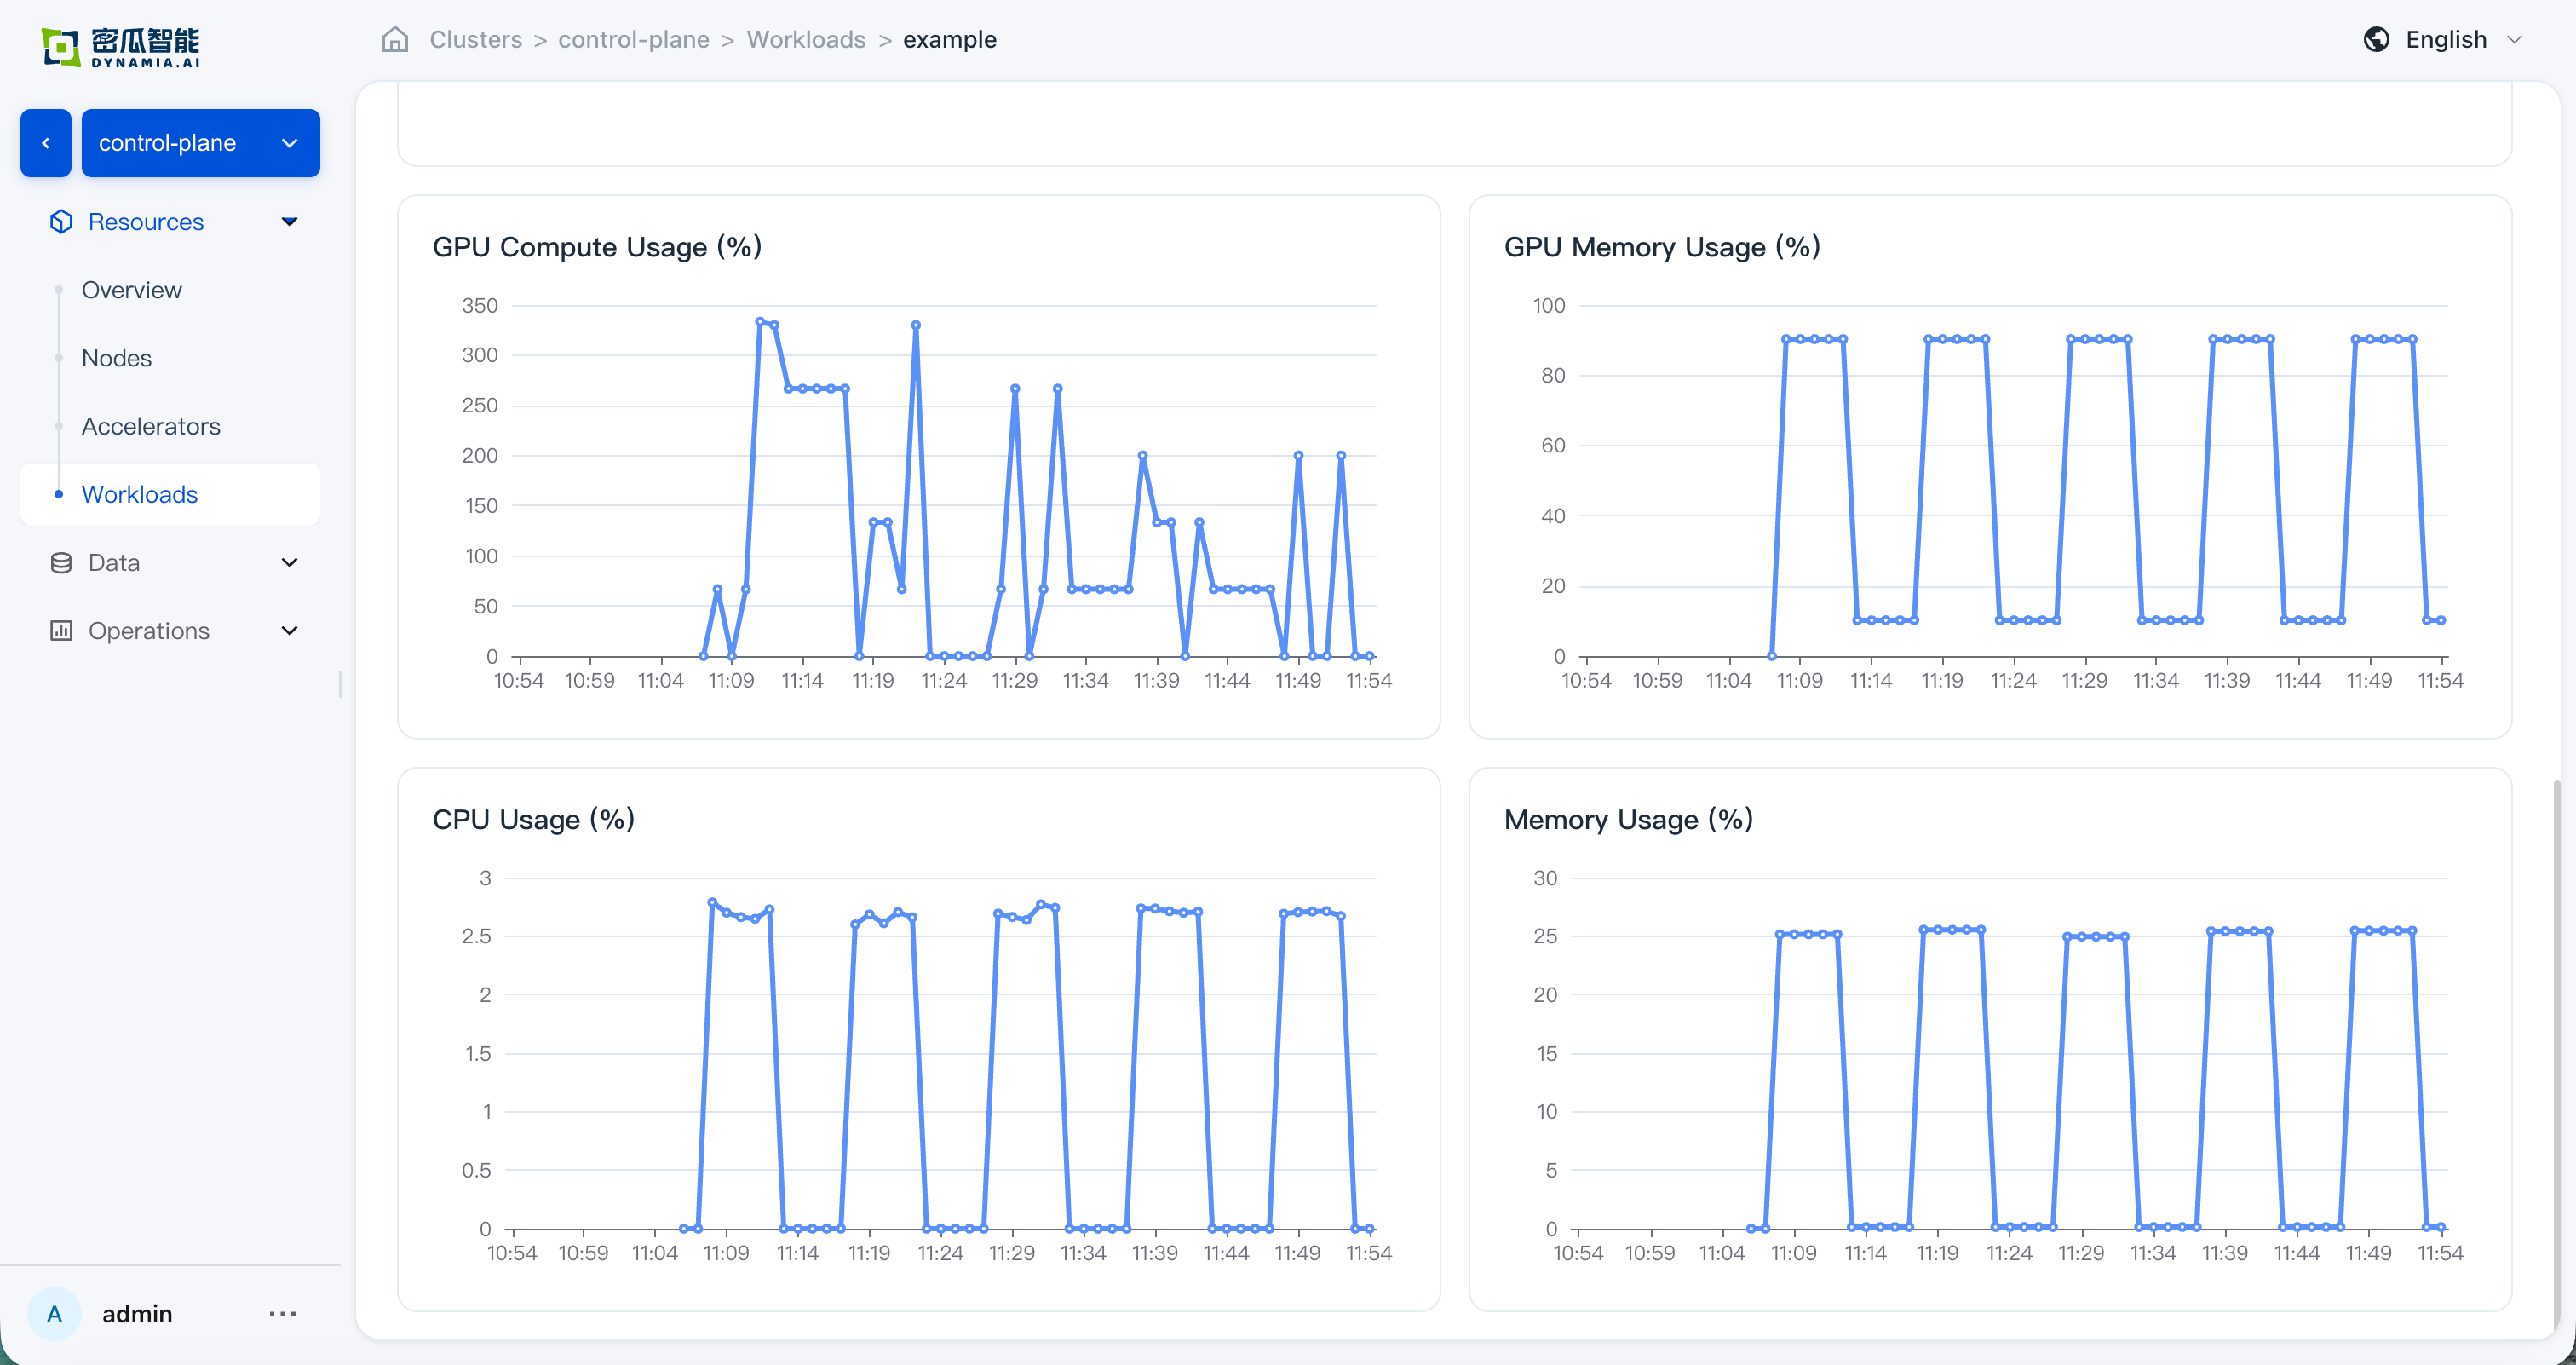
en: Application details
Troubleshooting
| Symptom | Likely Cause | Fix |
|---|---|---|
| Images fail to pull | Node has no external network or poor connectivity to ghcr.io | Contact Dynamia.ai sales/support for Chinese domestic mirror registry or the All-in-One air-gap bundle |
device-plugin pod Pending or missing | Node not labeled gpu=on | kubectl label nodes <node> gpu=on |
device-plugin pod CrashLoopBackOff | Conflict with NVIDIA's default device-plugin | Disable GPU Operator's devicePlugin (--set devicePlugin.enabled=false) |
| Prometheus missing HAMi metrics | serviceMonitorNamespaceSelector doesn't match ServiceMonitor label | Align prometheus/prometheus-kube-prometheus-prometheus .spec.serviceMonitorSelector with hami-enterprise serviceMonitor labels |
nvidia-smi errors | GPU driver not ready | Check driver pod status in gpu-operator namespace |
HAMi AI Platform pod ImagePullBackOff | Wrong image registry in values.yaml | Check image.registry / image.repository configuration |
Get Support
- Email: info@dynamia.ai
- Sales / Support: 400-026-7800
- Customers under commercial contract: please use your dedicated support channel for issues
Enterprise SLA: Both HAMi Enterprise and HAMi AI Platform come with 24/7 support, hotfix response, and long-term release maintenance.