HAMI vGPU Solution: Core & Memory Isolation Test
I previously shared an overview of the open-source vGPU solution, HAMI. This article will focus on testing its GPU Core and Memory isolation capabilities.
This article is adapted from: https://mp.weixin.qq.com/s/qfdHqpendMC6_zS_isCluw
TL;DR
The Core & Memory isolation provided by the HAMI vGPU solution performs as expected:
- Core Isolation: The computing power a Pod can use fluctuates around the set value, but the average over a period of time is consistent with the requested
gpucores(the GPU core resource quota set for the Pod). - Memory Isolation: When a Pod requests GPU memory exceeding the set limit, it immediately triggers a CUDA OOM (Out of Memory) error.
1. Environment Setup
Here’s a simple setup for our test environment:
- GPU: 2 x A40
- K8s: v1.23.17
- HAMI: v2.3.13
GPU Environment
I'll use the GPU-Operator to install the GPU driver, container runtime, and other necessities.
Then, install HAMI by following the guide in the -> previous article "Open-Source vGPU Solution: HAMI for Fine-Grained GPU Sharing"
Test Environment
A torch image-based Pod is sufficient for our testing purposes.
docker pull pytorch/pytorch:2.4.1-cuda11.8-cudnn9-runtime
Test Script
We can use the examples provided by PyTorch as our test script.
docker pull pytorch/pytorch:2.4.1-cuda11.8-cudnn9-runtime
This is a training demo that prints the time taken for each step. The lower the allocated computing power, the longer each step will take.
Usage is straightforward:
First, clone the project.
git clone https://github.com/pytorch/examples.git
Then, start the service to simulate a GPU-intensive task.
cd /mnt/imagenet/
python main.py -a resnet18 --dummy
Configuration
We need to inject the environment variable GPU_CORE_UTILIZATION_POLICY=force into the Pod.
This environment variable controls the GPU core utilization restriction policy. Common values are default (restricts computing power only when multiple Pods share the same GPU) and force (always enforces the computing power limit, regardless of other Pods). The default value is default.
By default, the policy is: if only one Pod is using the GPU, its computing power will not be limited.
Note: This can be seen as an optimization to improve GPU utilization—might as well use the idle resources. To enforce the limit strictly, you must add this environment variable.
Complete YAML
I'll mount the examples project into the Pod using a hostPath for testing and set the command to launch the script.
By configuring the vGPU resource requests/limits in the YAML file, I'll restrict it to 30% and 60% respectively for testing.
The complete YAML is as follows:
apiVersion: v1
kind: Pod
metadata:
  name: hami-30
  namespace: default
spec:
  containers:
  - name: simple-container
    image: pytorch/pytorch:2.4.1-cuda11.8-cudnn9-runtime
    command: ["python", "/mnt/imagenet/main.py", "-a", "resnet18", "--dummy"]
    resources:
      requests:
        cpu: "4"
        memory: "32Gi"
        nvidia.com/gpu: "1"
        nvidia.com/gpucores: "30"
        nvidia.com/gpumem: "20000"
      limits:
        cpu: "4"
        memory: "32Gi"
        nvidia.com/gpu: "1"
        nvidia.com/gpucores: "30"
        nvidia.com/gpumem: "20000"
    env:
    - name: GPU_CORE_UTILIZATION_POLICY
      value: "force"
    volumeMounts:
    - name: imagenet-volume
      mountPath: /mnt/imagenet
    - name: shm-volume
      mountPath: /dev/shm
  restartPolicy: Never
  volumes:
  - name: imagenet-volume
    hostPath:
      path: /root/lixd/hami/examples/imagenet
      type: Directory
  - name: shm-volume
    emptyDir:
      medium: Memory
2. Core Isolation Test
30% Utilization
Here are the results with gpucores set to 30%:
[HAMI-core Msg(15:140523803275776:libvgpu.c:836)]: Initializing.....
[HAMI-core Warn(15:140523803275776:utils.c:183)]: get default cuda from (null)
[HAMI-core Msg(15:140523803275776:libvgpu.c:855)]: Initialized
/mnt/imagenet/main.py:110: UserWarning: nccl backend >=2.5 requires GPU count>1, see https://github.com/NVIDIA/nccl/issues/103  perhaps use 'gloo'
  warnings.warn("nccl backend >=2.5 requires GPU count>1, see https://github.com/NVIDIA/nccl/issues/103  perhaps use 'gloo'")
=> creating model 'resnet18'
=> Dummy data is used!
Epoch: [0][    1/5005]        Time  4.338 ( 4.338)        Data  1.979 ( 1.979)        Loss 7.0032e+00 (7.0032e+00)        Acc@1   0.00 (  0.00)        Acc@5   0.00 (  0.00)
Epoch: [0][   11/5005]        Time  0.605 ( 0.806)        Data  0.000 ( 0.187)        Loss 7.1570e+00 (7.0590e+00)        Acc@1   0.00 (  0.04)        Acc@5   0.39 (  0.39)
Epoch: [0][   21/5005]        Time  0.605 ( 0.706)        Data  0.000 ( 0.098)        Loss 7.1953e+00 (7.1103e+00)        Acc@1   0.00 (  0.06)        Acc@5   0.39 (  0.56)
Epoch: [0][   31/5005]        Time  0.605 ( 0.671)        Data  0.000 ( 0.067)        Loss 7.2163e+00 (7.1379e+00)        Acc@1   0.00 (  0.04)        Acc@5   1.56 (  0.55)
Epoch: [0][   41/5005]        Time  0.608 ( 0.656)        Data  0.000 ( 0.051)        Loss 7.2501e+00 (7.1549e+00)        Acc@1   0.39 (  0.07)        Acc@5   0.39 (  0.60)
Epoch: [0][   51/5005]        Time  0.611 ( 0.645)        Data  0.000 ( 0.041)        Loss 7.1290e+00 (7.1499e+00)        Acc@1   0.00 (  0.09)        Acc@5   0.39 (  0.60)
Epoch: [0][   61/5005]        Time  0.613 ( 0.639)        Data  0.000 ( 0.035)        Loss 6.9827e+00 (7.1310e+00)        Acc@1   0.00 (  0.12)        Acc@5   0.39 (  0.60)
Epoch: [0][   71/5005]        Time  0.610 ( 0.635)        Data  0.000 ( 0.030)        Loss 6.9808e+00 (7.1126e+00)        Acc@1   0.00 (  0.11)        Acc@5   0.39 (  0.61)
Epoch: [0][   81/5005]        Time  0.617 ( 0.630)        Data  0.000 ( 0.027)        Loss 6.9540e+00 (7.0947e+00)        Acc@1   0.00 (  0.11)        Acc@5   0.78 (  0.64)
Epoch: [0][   91/5005]        Time  0.608 ( 0.628)        Data  0.000 ( 0.024)        Loss 6.9248e+00 (7.0799e+00)        Acc@1   1.17 (  0.12)        Acc@5   1.17 (  0.64)
Epoch: [0][ 101/5005]        Time  0.616 ( 0.626)        Data  0.000 ( 0.022)        Loss 6.9546e+00 (7.0664e+00)        Acc@1   0.00 (  0.11)        Acc@5   0.39 (  0.61)
Epoch: [0][ 111/5005]        Time  0.610 ( 0.625)        Data  0.000 ( 0.020)        Loss 6.9371e+00 (7.0565e+00)        Acc@1   0.00 (  0.11)        Acc@5   0.39 (  0.61)
Epoch: [0][ 121/5005]        Time  0.608 ( 0.621)        Data  0.000 ( 0.018)        Loss 6.9403e+00 (7.0473e+00)        Acc@1   0.00 (  0.11)        Acc@5   0.78 (  0.60)
Epoch: [0][ 131/5005]        Time  0.611 ( 0.620)        Data  0.000 ( 0.017)        Loss 6.9016e+00 (7.0384e+00)        Acc@1   0.00 (  0.10)        Acc@5   0.00 (  0.59)
Epoch: [0][ 141/5005]        Time  0.487 ( 0.619)        Data  0.000 ( 0.016)        Loss 6.9410e+00 (7.0310e+00)        Acc@1   0.00 (  0.10)        Acc@5   0.39 (  0.58)
Epoch: [0][ 151/5005]        Time  0.608 ( 0.617)        Data  0.000 ( 0.015)        Loss 6.9647e+00 (7.0251e+00)        Acc@1   0.00 (  0.10)        Acc@5   0.00 (  0.56)
Each step takes about 0.6 seconds.
GPU Usage:
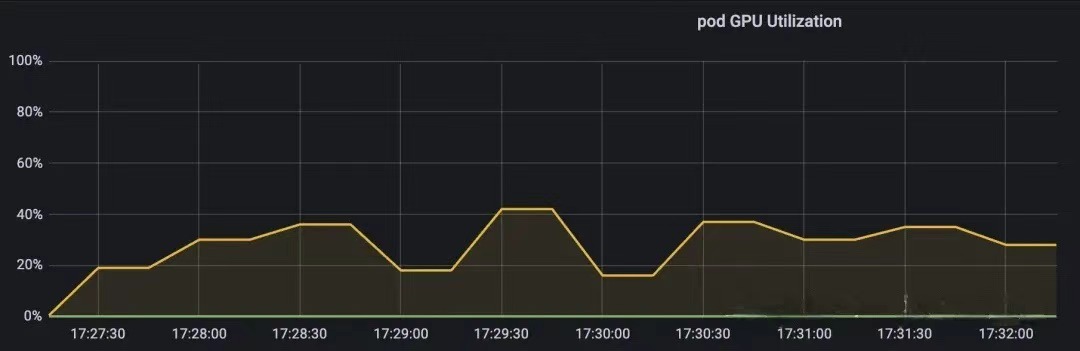
As you can see, the usage fluctuates around our target of 30% and averages out to approximately 30% over time.
60% Utilization
Here are the results at 60% utilization:
root@jhami:~/lixd/hami# kubectl logs -f hami-60
[HAMI-core Msg(1:140477390922240:libvgpu.c:836)]: Initializing.....
[HAMI-core Warn(1:140477390922240:utils.c:183)]: get default cuda from (null)
[HAMI-core Msg(1:140477390922240:libvgpu.c:855)]: Initialized
/mnt/imagenet/main.py:110: UserWarning: nccl backend >=2.5 requires GPU count>1, see https://github.com/NVIDIA/nccl/issues/103  perhaps use 'gloo'
  warnings.warn("nccl backend >=2.5 requires GPU count>1, see https://github.com/NVIDIA/nccl/issues/103  perhaps use 'gloo'")
=> creating model 'resnet18'
=> Dummy data is used!

Epoch: [0][    1/5005]   Time  4.752 ( 4.752)   Data  2.255 ( 2.255)   Loss 7.0527e+00 (7.0527e+00)   Acc@1   0.00 (  0.00)   Acc@5   0.39 (  0.39)
Epoch: [0][   11/5005]   Time  0.227 ( 0.597)   Data  0.000 ( 0.206)   Loss 7.0772e+00 (7.0501e+00)   Acc@1   0.00 (  0.25)   Acc@5   1.17 (  0.78)
Epoch: [0][   21/5005]   Time  0.234 ( 0.413)   Data  0.000 ( 0.129)   Loss 7.0813e+00 (7.1149e+00)   Acc@1   0.00 (  0.20)   Acc@5   0.39 (  0.73)
Epoch: [0][   31/5005]   Time  0.401 ( 0.360)   Data  0.325 ( 0.125)   Loss 7.2436e+00 (7.1553e+00)   Acc@1   0.00 (  0.14)   Acc@5   0.78 (  0.67)
Epoch: [0][   41/5005]   Time  0.190 ( 0.336)   Data  0.033 ( 0.119)   Loss 7.0519e+00 (7.1684e+00)   Acc@1   0.00 (  0.10)   Acc@5   0.00 (  0.62)
Epoch: [0][   51/5005]   Time  0.627 ( 0.327)   Data  0.536 ( 0.123)   Loss 7.1113e+00 (7.1641e+00)   Acc@1   0.00 (  0.11)   Acc@5   1.17 (  0.67)
Epoch: [0][   61/5005]   Time  0.184 ( 0.306)   Data  0.000 ( 0.109)   Loss 7.0776e+00 (7.1532e+00)   Acc@1   0.00 (  0.10)   Acc@5   0.78 (  0.65)
Epoch: [0][   71/5005]   Time  0.413 ( 0.298)   Data  0.343 ( 0.108)   Loss 6.9763e+00 (7.1325e+00)   Acc@1   0.39 (  0.13)   Acc@5   1.17 (  0.67)
Epoch: [0][   81/5005]   Time  0.200 ( 0.289)   Data  0.000 ( 0.103)   Loss 6.9667e+00 (7.1155e+00)   Acc@1   0.00 (  0.13)   Acc@5   1.17 (  0.68)
Epoch: [0][   91/5005]   Time  0.301 ( 0.284)   Data  0.219 ( 0.102)   Loss 6.9920e+00 (7.0990e+00)   Acc@1   0.00 (  0.13)   Acc@5   1.17 (  0.67)
Epoch: [0][  101/5005]   Time  0.365 ( 0.280)   Data  0.000 ( 0.097)   Loss 6.9519e+00 (7.0846e+00)   Acc@1   0.00 (  0.12)   Acc@5   0.39 (  0.66)
Epoch: [0][  111/5005]   Time  0.239 ( 0.284)   Data  0.000 ( 0.088)   Loss 6.9559e+00 (7.0732e+00)   Acc@1   0.39 (  0.13)   Acc@5   0.78 (  0.62)
Epoch: [0][  121/5005]   Time  0.368 ( 0.286)   Data  0.000 ( 0.082)   Loss 6.9594e+00 (7.0626e+00)   Acc@1   0.00 (  0.13)   Acc@5   0.78 (  0.63)
Epoch: [0][  131/5005]   Time  0.363 ( 0.287)   Data  0.000 ( 0.075)   Loss 6.9408e+00 (7.0535e+00)   Acc@1   0.00 (  0.13)   Acc@5   0.00 (  0.60)
Epoch: [0][  141/5005]   Time  0.241 ( 0.288)   Data  0.000 ( 0.070)   Loss 6.9311e+00 (7.0456e+00)   Acc@1   0.00 (  0.12)   Acc@5   0.00 (  0.58)
Epoch: [0][  151/5005]   Time  0.367 ( 0.289)   Data  0.000 ( 0.066)   Loss 6.9441e+00 (7.0380e+00)   Acc@1   0.00 (  0.13)   Acc@5   0.78 (  0.58)
Epoch: [0][  161/5005]   Time  0.372 ( 0.290)   Data  0.000 ( 0.062)   Loss 6.9347e+00 (7.0317e+00)   Acc@1   0.78 (  0.13)   Acc@5   1.56 (  0.59)
Epoch: [0][  171/5005]   Time  0.241 ( 0.290)   Data  0.000 ( 0.058)   Loss 6.9432e+00 (7.0268e+00)   Acc@1   0.00 (  0.13)   Acc@5   0.39 (  0.58)
Each step now takes about 0.3 seconds. This is half the time it took at 30% (0.6s), which is consistent with doubling the computing power from 30% to 60%.
The GPU usage is:
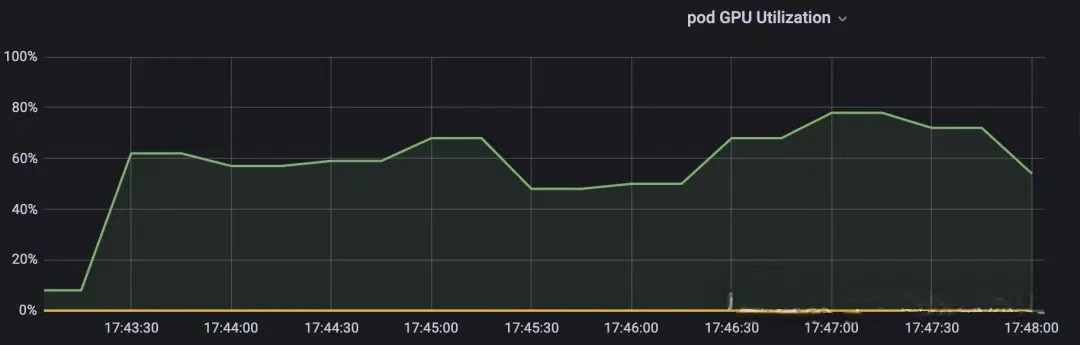
Similarly, it fluctuates within a certain range, with the average being very close to the 60% limit.
3. Memory Isolation Test
I just need to specify 20000M of memory in the Pod's resources.
resources:
  requests:
    cpu: "4"
    memory: "8Gi"
    nvidia.com/gpu: "1"
    nvidia.com/gpucores: "60"
    nvidia.com/gpumem: "200000"
Then, checking from within the Pod shows only 20000M available.
root@hami-30:/mnt/b66582121706406e9797ffaf64a831b0# nvidia-smi
[HAMI-core Msg(68:139953433691968:libvgpu.c:836)]: Initializing.....
Mon Oct 14 13:14:23 2024
+-----------------------------------------------------------------------------+
| NVIDIA-SMI 525.147.05    Driver Version: 525.147.05    CUDA Version: 12.0   |
|-------------------------------+----------------------+----------------------+
| GPU  Name        Persistence-M| Bus-Id        Disp.A | Volatile Uncorr. ECC |
| Fan  Temp  Perf  Pwr:Usage/Cap|        Memory-Usage | GPU-Util  Compute M. |
|                               |                     |              MIG M. |
|===============================+=====================+======================|
|   0  NVIDIA A40        Off  | 00000000:00:07.0 Off |                   0  |
|  0%   30C    P8    29W / 300W|     0MiB / 20000MiB |      0%      Default  |
|                               |                     |                 N/A  |
+-------------------------------+----------------------+----------------------+

+-----------------------------------------------------------------------------+
| Processes:                                                                  |
|  GPU   GI   CI        PID   Type   Process name                  GPU Memory |
|        ID   ID                                               Usage          |
|=============================================================================|
|  No running processes found                                                 |
+-----------------------------------------------------------------------------+
[HAMI-core Msg(68:139953433691968:multiprocess_memory_limit.c:468)]: Calling exit handler 68
Test Script
Now, let's run a script to see if it causes an OOM error after allocating 20000M.
import torch
import sys

def allocate_memory(memory_size_mb):
    # Convert MB to bytes and compute the number of float32 elements
    num_elements = memory_size_mb * 1024 * 1024 // 4  # 1 float32 = 4 bytes
    try:
        # Attempt to allocate GPU memory
        print(f"Attempting to allocate {memory_size_mb} MB on GPU...")
        x = torch.empty(num_elements, dtype=torch.float32, device='cuda')
        print(f"Successfully allocated {memory_size_mb} MB on GPU.")
    except RuntimeError as e:
        print(f"Failed to allocate {memory_size_mb} MB on GPU: OOM.")
        print(e)

if __name__ == "__main__":
    # Read from command line; default to 1024 MB if not provided
    memory_size_mb = int(sys.argv[1]) if len(sys.argv) > 1 else 1024
    allocate_memory(memory_size_mb)
Let's start.
root@hami-30:/mnt/b66582121706406e9797ffaf64a831b0/lixd/hami-test# python test_oom.py 20000
[HAMI-core Msg(1046:140457967137280:libvgpu.c:836)]: Initializing.....
Attempting to allocate 20000 MB on GPU...
[HAMI-core Warn(1046:140457967137280:utils.c:183)]: get default cuda from (null)
[HAMI-core Msg(1046:140457967137280:libvgpu.c:855)]: Initialized
[HAMI-core ERROR (pid:1046 thread=140457967137280 allocator.c:49)]: Device 0 OOM 21244149760 / 20971520000
Failed to allocate 20000 MB on GPU: OOM.
CUDA error: unrecognized error code
CUDA kernel errors might be asynchronously reported at some other API call, so the stacktrace below might be incorrect.
For debugging consider passing CUDA_LAUNCH_BLOCKING=1
Compile with `TORCH_USE_CUDA_DSA` to enable device-side assertions.

[HAMI-core Msg(1046:140457967137280:multiprocess_memory_limit.c:468)]: Calling exit handler 1046
It went OOM immediately. Looks like that was the absolute limit. Let's try 19500M.
root@hami-30:/mnt/b66582121706406e9797ffaf64a831b0/lixd/hami-test# python test_oom.py 19500
[HAMI-core Msg(1259:140397947200000:libvgpu.c:836)]: Initializing.....
Attempting to allocate 19500 MB on GPU...
[HAMI-core Warn(1259:140397947200000:utils.c:183)]: get default cuda from (null)
[HAMI-core Msg(1259:140397947200000:libvgpu.c:855)]: Initialized
Successfully allocated 19500 MB on GPU.
[HAMI-core Msg(1259:140397947200000:multiprocess_memory_limit.c:468)]: Calling exit handler 1259
Everything is normal. This confirms that HAMI's memory isolation is working correctly.
4. Summary
The test results are as follows:
Core Isolation
- With
gpucoresset to 30%, the task took 0.6s per step, and Grafana showed GPU utilization fluctuating around 30%. - With
gpucoresset to 60%, the task took 0.3s per step, and Grafana showed GPU utilization fluctuating around 60%.
We can conclude that the Core isolation provided by the HAMI vGPU solution behaves as expected.
Memory Isolation
- With
gpumemset to 20000M, attempting to allocate 20000M resulted in an OOM error, while allocating 19500M succeeded.
We can conclude that the Memory isolation provided by the HAMI vGPU solution behaves as expected.
In short:
- Core Isolation: A Pod's usable computing power fluctuates around the set value, but the average over time aligns with the requested
gpucores. - Memory Isolation: If a Pod attempts to allocate GPU memory beyond the set limit, it will immediately trigger a CUDA OOM error.
To learn more about the HAMi project, please visit our GitHub repository or join our Slack community.